Last updated: September 25, 2025
Current Market Observations in Precious Metals Trends 2025
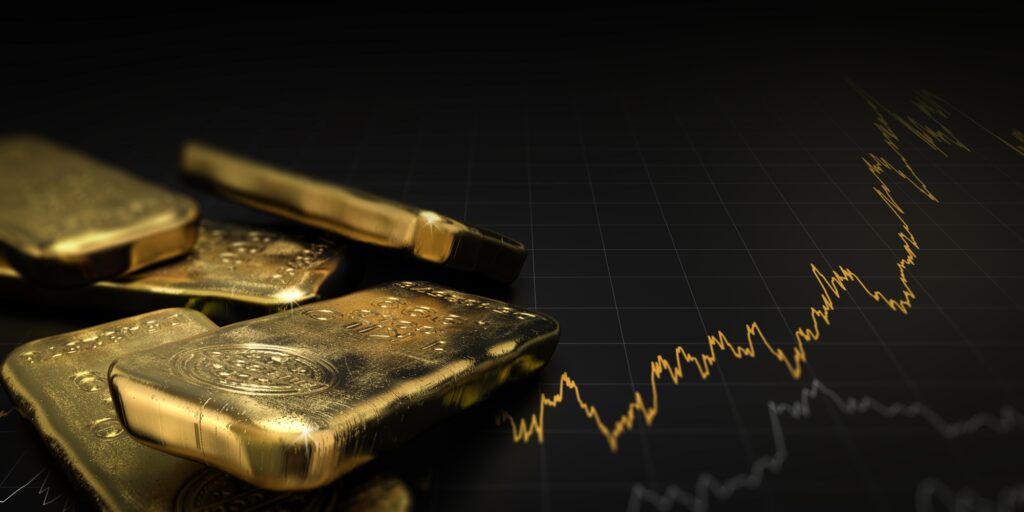
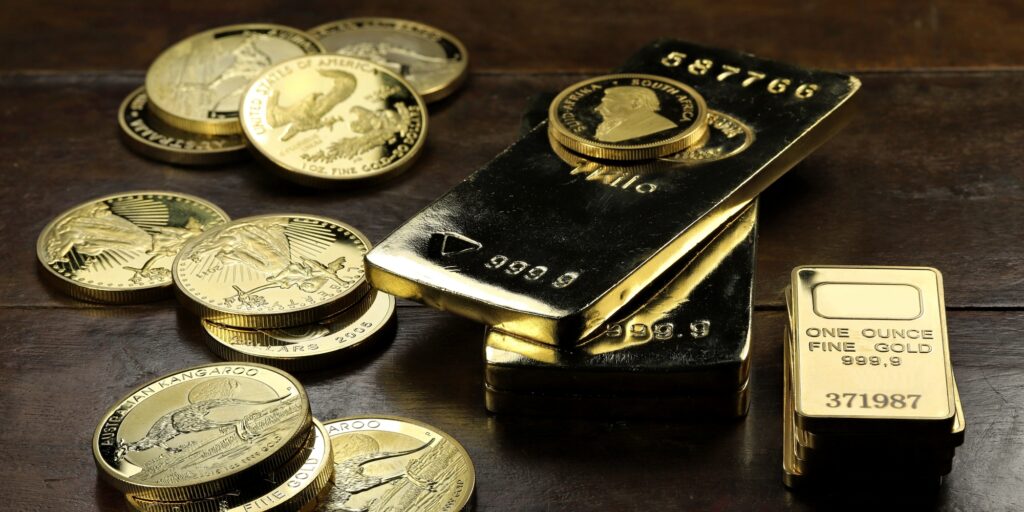
Precious metals trends 2025 reflect ongoing market activities based on public reports. Recent observations show gold prices in the range of $3,800 to $3,900 per ounce, following variations in trading sessions. Silver has traded around $47 per ounce, showing changes from prior levels.
Public records from sources like the World Gold Council note that central banks have reported net purchases exceeding 1,000 tons annually since 2022. For instance, the National Bank of Poland added 67 tons year-to-date through mid-2025. A survey indicated that 44% of central banks actively managed their gold reserves in 2025, up from 37% the previous year. In July 2025 alone, global central banks reported a net allocation of 10 tons based on available data.
Silver’s role in precious metals trends 2025 also draws from public industrial data. Historical records show the use of silver in electronics, solar panels, and medical applications, with global supply deficits noted for several consecutive years through 2025.
The Silver Institute reported a market deficit for the seventh year in a row as of mid-2025, influenced by factors like mining output and fabrication demand. Such patterns provide context for understanding supply dynamics over time. These are historical observations and not indicative of future trends.
Historical Debt Cycles and Economic Patterns
Precious metals trends 2025 can be viewed through the lens of long-term economic patterns, such as debt cycles documented in historical records. Global debt levels reached $338 trillion in the first half of 2025, marking an increase of $21 trillion from prior periods. As a share of global GDP, total debt stabilized just above 235 percent, according to the IMF’s latest Global Debt Monitor update. This follows patterns seen over centuries, where borrowing exceeds income, leading to adjustments in major economies.
For example, in the 1700s, the Dutch faced currency challenges amid high debt from trade expansions and speculative bubbles like the Tulip Mania of 1637, where asset prices surged and then collapsed due to overextension. Post-World War II, Britain dealt with elevated debts during its imperial decline, with public debt peaking at over 250 percent of GDP in the 1940s, prompting austerity measures and policy shifts as outlined in economic histories.
In the 19th century U.S., railroad developments involved significant land grants and credit, contributing to debt accumulation and financial panics like the Panic of 1873, where overleveraged infrastructure projects led to widespread defaults.
The Great Depression in the 1930s provides another example, triggered by the 1929 stock market crash and exacerbated by international debt imbalances, resulting in global unemployment spikes and policy responses like the New Deal. These cycles often involve steps like increased spending, policy responses such as interest rate adjustments, and eventual rebalancing, as outlined in studies of fiscal history.
In recent U.S. policy, the Federal Reserve adjusted the federal funds rate to a range of 4.00%-4.25% following a 25 basis point cut in September 2025. This restates a public announcement and aligns with historical monetary adjustments during debt periods. Such events provide context for understanding broader economic records, without implying outcomes.
Central Bank Activities in Precious Metals Trends 2025
Central banks play a documented role in precious metals trends 2025, based on publicly available data. Institutions in emerging markets, including those in China and India, have increased gold reserves in recent years, as reported by the World Gold Council. Overall, central bank purchases have contributed to market dynamics, with net additions noted in quarterly updates through March 2025.
Historical surveys show a rise in active reserve management, from 37% in 2024 to 44% in 2025, with many citing diversification as a factor in public disclosures. Sourcing from local mines has been mentioned in industry reports during periods of sustained prices, supporting domestic production data.
These activities tie into efforts to maintain reserves, as reflected in IMF and council publications. For example, holdings data as of March 2025 show varied allocations across countries, with late reporters from December 2024.
Educational Insights from Precious Metals Trends 2025
Examining precious metals trends 2025 through historical lenses highlights recurring patterns in global finance, such as those in debt and reserve management. Public data from sources like the IMF indicate total global debt remains above 235% of world GDP as of recent updates, with public debt expected to approach 100% of global GDP by the decade’s end. This provides a factual backdrop for studying economic cycles, from 19th-century U.S. expansions fueled by credit to modern fiscal reports on rising public liabilities.
Precious metals have appeared in these contexts for centuries, with gold serving as a benchmark in international monetary systems like the Gold Standard from 1870 to 1914, where currencies were pegged to fixed amounts of the metal. The abandonment during World War I marked a shift to fiat systems, influencing subsequent debt management strategies. Silver’s historical use in coinage dates to ancient economies, evolving into industrial roles by the 20th century, as tracked in U.S. Mint records. These evolutions offer insights into how metals intersect with economic history, based on archival and public data.
Disclaimer: This article is for educational purposes only. Gold Silver Markets is not a financial advisor, and this content does not constitute investment advice. Precious metals markets involve risks, including price fluctuations. Always consult a qualified financial professional before making decisions. Past performance is not a guarantee of future results, and nobody can accurately predict where prices will go in the future.


